In this report, users have the possibility to search the scenario filtered by portfolio, and if the user wishes to seek a proposal or a set of proposals, the report allows the utilization of filters for this purpose.
The report structure has the following composition:
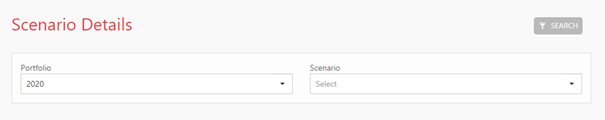
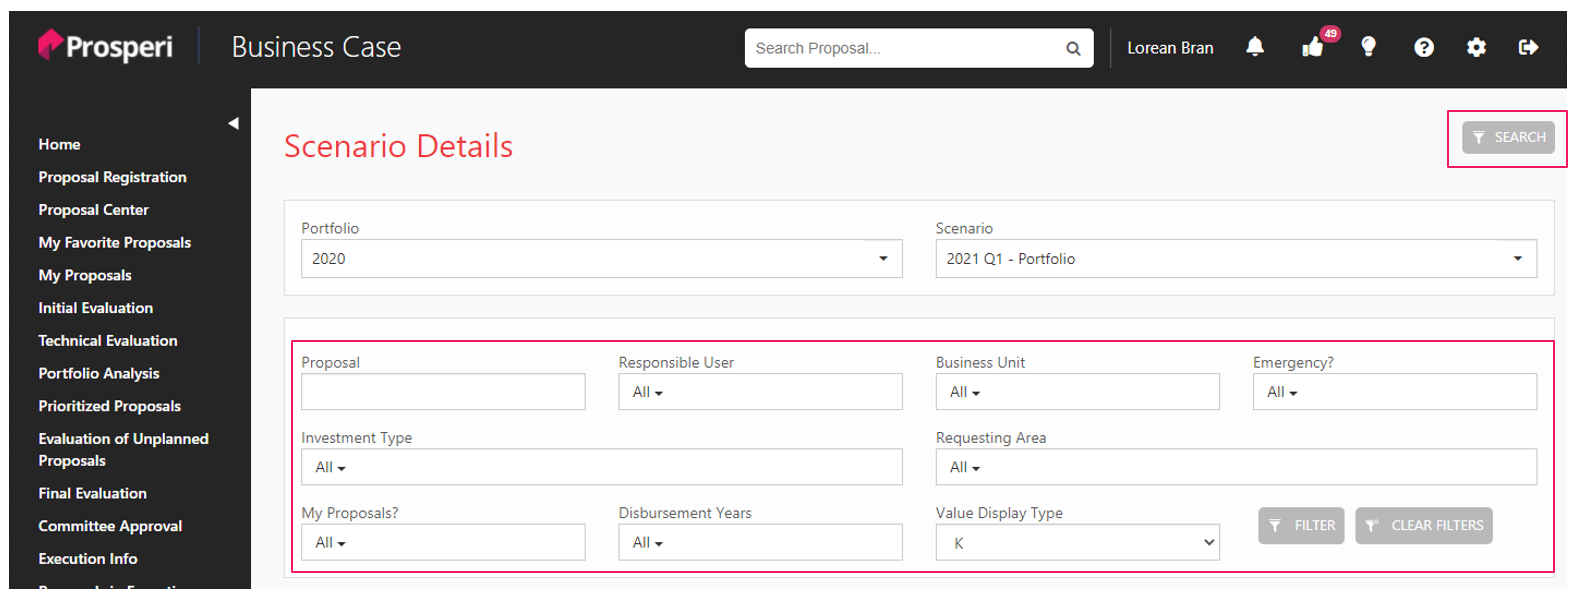
1) Portfolio and Scenario: This is a cascading filter; first the user must choose the portfolio year and then choose the scenario they want to view.
2) Proposal Filters: Filters for proposals within the scenario can be searched using the following fields:
a. Proposal
b. Responsible User
c. Business Unit
d. Emergency?
e. Investment Type
f. Requesting Area
g. My proposals?
h. Disbursement Years
i. Value Display type
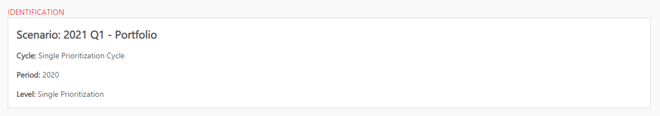
3) Identification: Displays scenario information
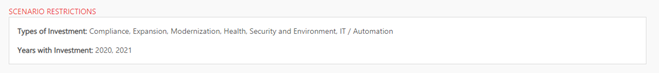
4) Scenario Restrictions: If the scenario has any restrictions, this information is reported here
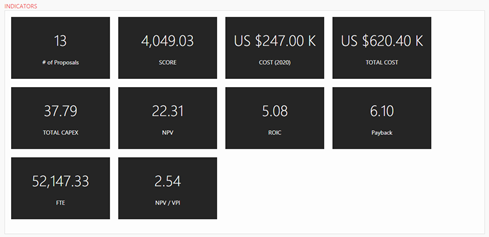
5) Indicators: Information on the composition of the scenario in relation to the KPI’s used for prioritization
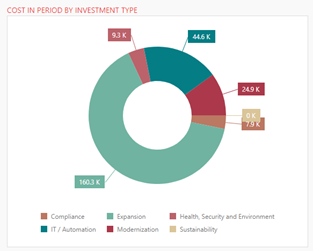
6) Cost in Period by Investment Type: Pie chart that shows the cost of projects grouped by Investment Type
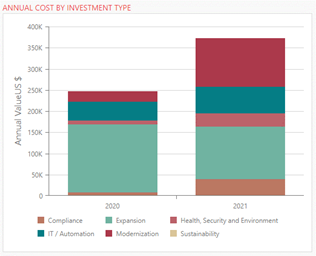
7) Annual Cost by Investment Type: Bar graph that displays the cost per year by Investment Type
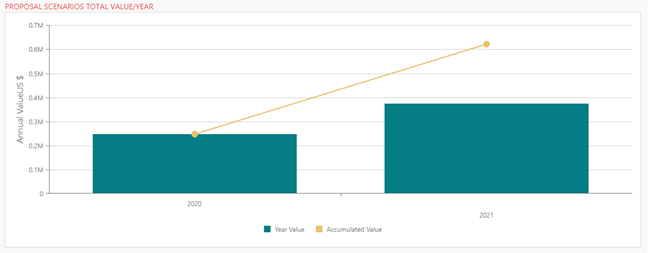
8) Proposal Scenarios Total Value/Year: Bar and line graph that displays the total value of scenario proposals by year
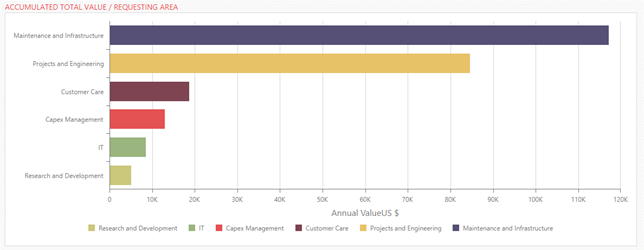
9) Accumulated Total Value/Requesting Area: Horizontal bar graph that displays the total cumulative value of projects per requesting area
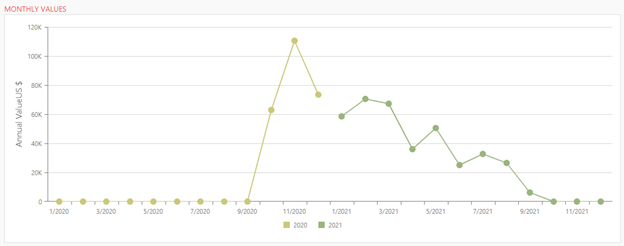
10) Monthly Values: Displays the month-to-month disbursement amounts for all projects in the scenario.
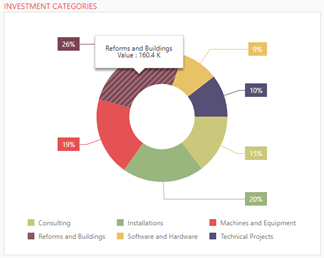
11) Investment Categories: Displays the percentage and value of proposals by Investment Type
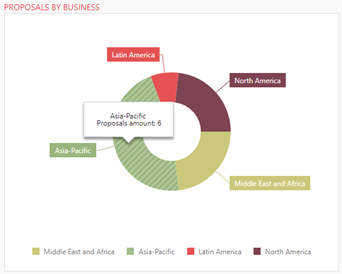
12) Proposals by Business: Displays the quantity of proposals per Executing Area
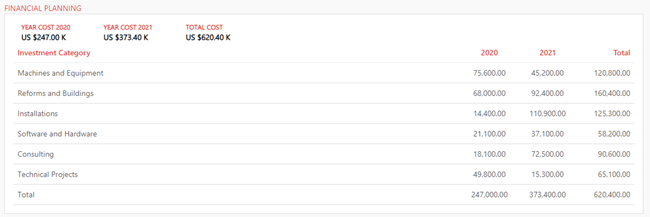
13) Financial Planning: Table that displays the total cost, by year and by Investment Category
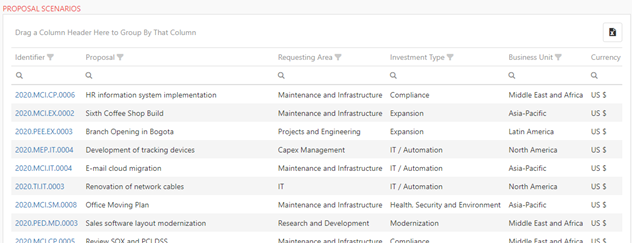
14) Proposal Scenarios: Table that displays all proposals that make up the scenario. This table allows users to perform searches and filters. Users can also export the data shown to Excel by clicking the Excel icon in the top right corner of this section.