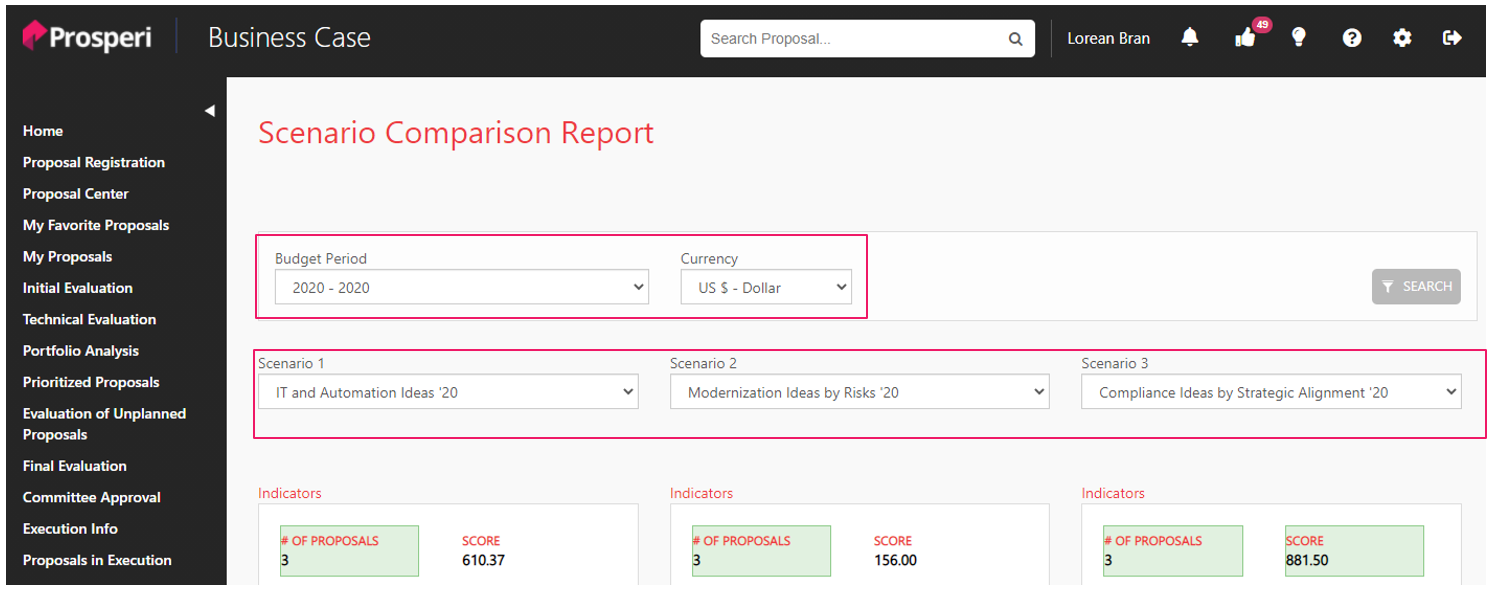
Within the same cycle of prioritization of proposals, users can have several scenarios created. For this reason, Teams Ideas™ Business Case & Portfolio Analysis has the Scenario Comparison report, which allows the comparison of up to three scenarios of the same budget cycle, side-by-side.
To perform the comparison, select the annual budget cycle, currency, and desired scenarios as shown in the image below.
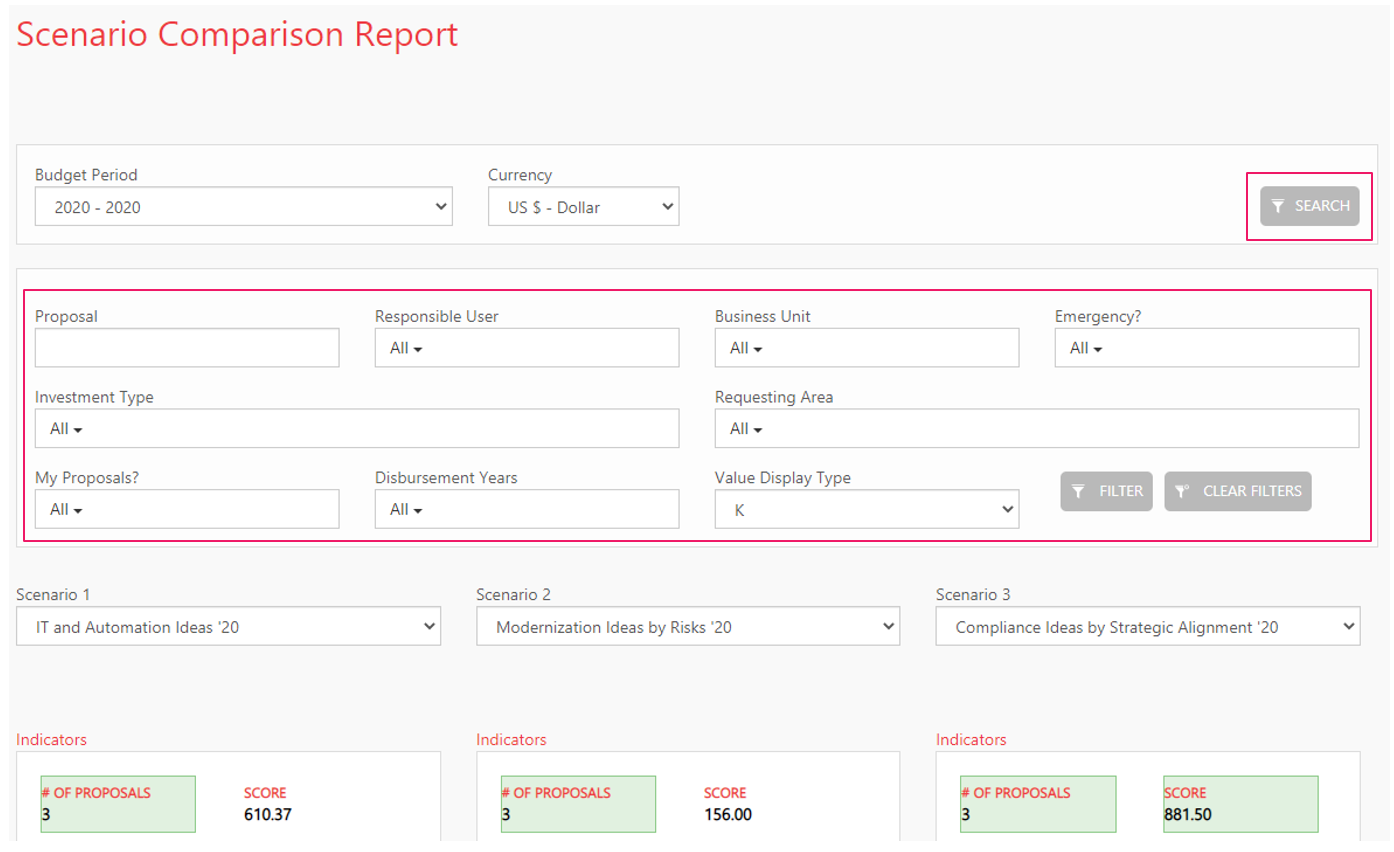
If the user wants to perform a more specific search by proposal feature, click the “Filters” button and fill in the required information.
The report structure has the following composition:
1) Proposal Filters: Filters for proposals within the scenario can be searched using the following fields:
a. Proposal
b. Responsible User
c. Business Unit
d. Emergency?
e. Investment Type
f. Requesting Area
g. My Proposals?
h. Disbursement Years
i. Value Display Type
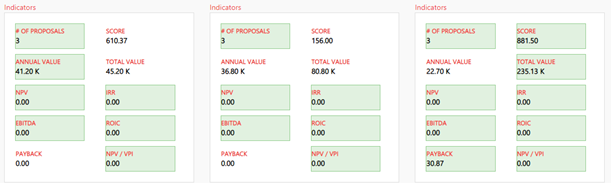
2) Indicators: Table that informs the indicators of that portfolio scenario. The scenario that has the highest value among the others compared, will be highlighted with the green table. Should two scenarios have the same highest value, both will be highlighted in green.
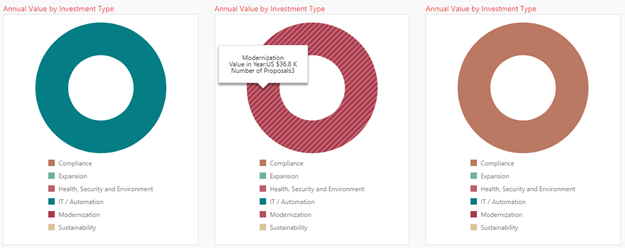
3) Annual Value by Investment Type: Displays the value and quantity of projects per Investment Type
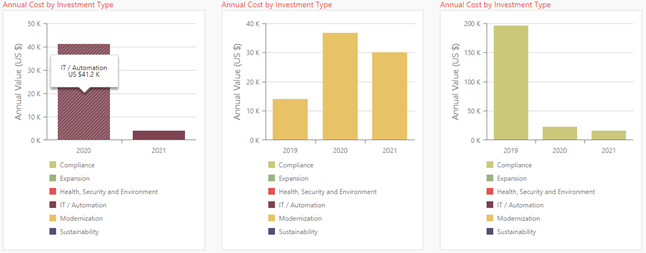
4) Annual Cost by Investment Type: Displays the total value per year of each investment type
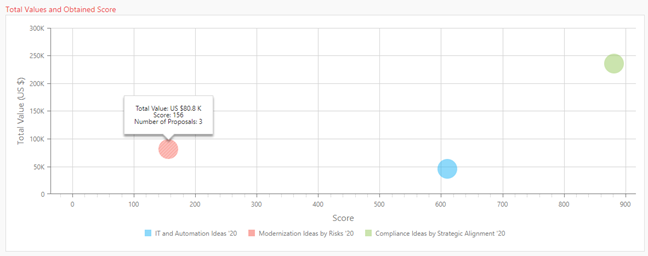
5) Total Values & Obtained Scores: Bubble chart where the total value of the scenario versus its score is displayed according to the prioritization criteria
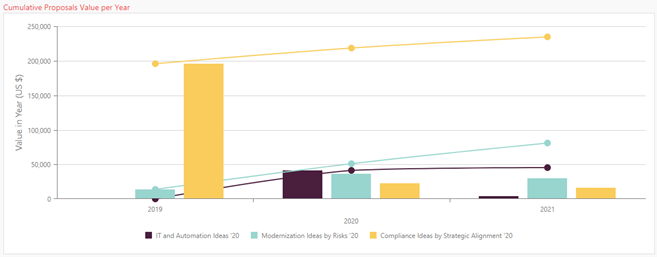
6) Cumulative Proposals Value per Year: Displays the total and accumulated value per year and by scenario