The Portfolio Tracking report is a report that aims to present the vision of all budget proposals within a given cycle with the possibility of carrying out various filters.
The report structure has the following composition:
1) Search Filters: The report allows users to perform multiple filters combined according to the fields below:
a. Portfolio: Single selection field indicating the portfolio year to be evaluated
b. Approval Authority Level: Single selection field indicating the approval authority level of the projects that will be presented. It is important to reinforce that every proposal belongs to at least one approval level, so the higher the chosen level, the higher the filter of the proposals.
c. Investment Type: Multiple selection field to indicate which types of investment should be displayed
d. Requesting Area: Multiple selection field to indicate which are the requesting areas to display
e. Business Unit: Multiple selection field to indicate which business units should be displayed
f. Status: Multiple selection field to indicate which statuses should be displayed
g. Committee: Multiple selection field to indicate which committee should be displayed
h. View Results by: Indicates which type of predominant result you want to display, by quantity or value
i. Disbursement Years: Multiple selection field to indicate what are the disbursement years to be displayed
j. Value Display Type: Single selection field to inform the display type of the values
2) Proposals by Status: Each status that the proposal passes saves a version of the proposal, and in this chart each status and information for these statuses is displayed. It is important to reinforce that proposals have version to each status that it exceeds, so the same proposal will appear in more than one bar and may or may not contain changes.
Each bar will display proposals that are in that status, and whether they are Pending, Approved, or Disapproved.
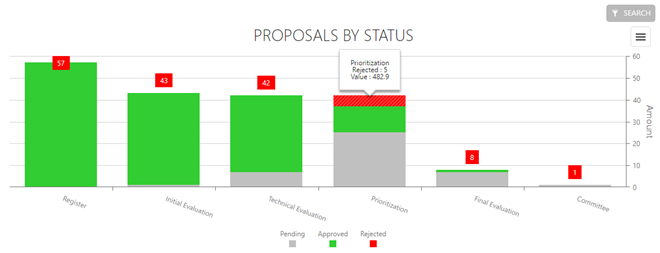
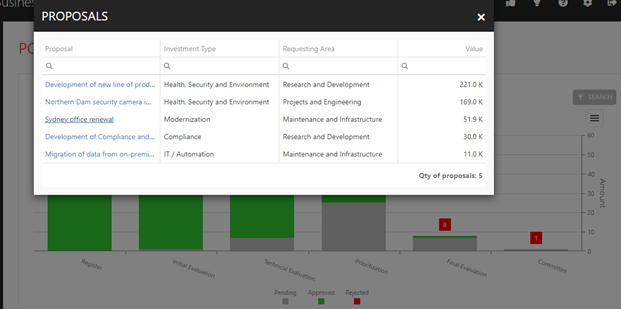
If a user wants to see more information about the proposals being considered in the chart, click on the item desired to view and the system will display a list of all proposals.
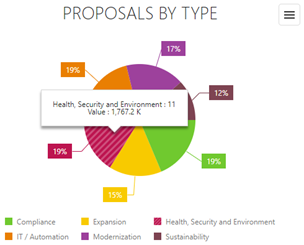
3) Proposals by Type: Displays proposals by Investment Type. When a user hovers over a slice of the chart, it will display the number of projects and their total value. To view the list of projects, click on the same slice.
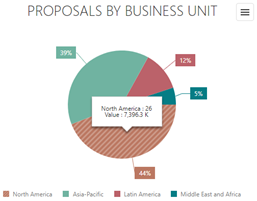
4) Proposals by Business Unit: Displays proposals by Business Unit. When a user hovers over a slice of the chart, it will display the number of projects and their total value. To view the list of projects, click on the same slice.
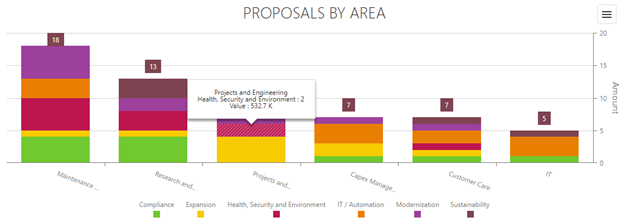
5) Proposals by Area: Displays the number of proposals per Requesting Area, grouped by Investment Type. On the Y axis, the graph measures the number of proposals, while on the X axis the chart groups the proposals by Requesting Area. With each grouping, the chart differentiates all Investment Types through various colors.
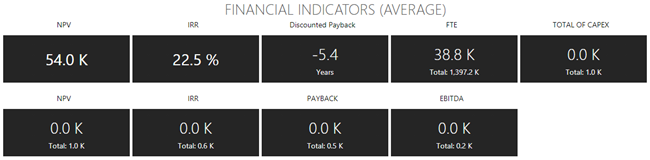
6) Financial Indicators (Average): Displays the average of the financial KPI from the proposals
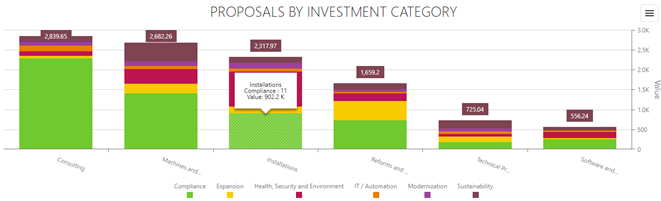
7) Proposals by Investment Category: This chart shows the values of the proposals by Investment Category. On the Y axis, the chart shows the value of the proposals, while on the X axis, the chart groups the proposals by Investment category. With each grouping, the chart differentiates all types of investment through colors.
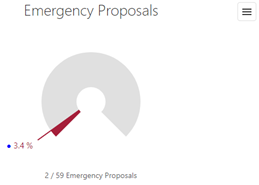
8) Emergency Proposals: Displays the percentage of proposals classified as emergency
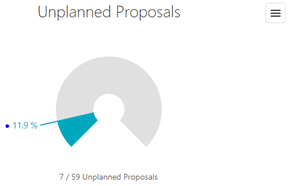
9) Unplanned Proposals: Displays the percentage of proposals created after the budget cycle.