The Risk Matrix report uses the score generated by the proposal's risk questionnaire to rank the proposals in a matrix quadrant showing probability versus impact, which is measured according to the limits configured to proposals.
The report structure has the following composition:
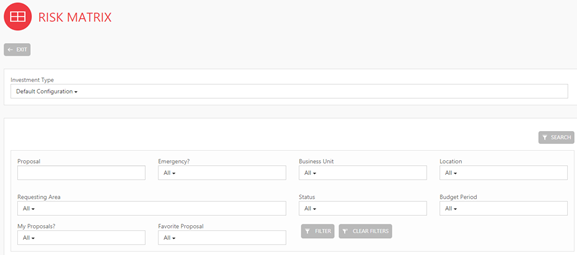
1) Search Filters: The report allows users to perform filters according to the fields below:
a. Proposal
b. Emergency?
c. Business Unit
d. Location
e. Requesting Area
f. Status
g. Budget Period
h. My Proposals?
i. Favorite Proposal
2) Matrix: The arrangement is 4 by 4 and this quantity is fixed and cannot be changed. Levels are measured with the following legend and score.
a. Probability:
i. Certainty: From 0 to 17.00
ii. Probable: From 17.01 to 27.00
iii. Possible: From 27.01 to 38.00
iv. Impossible: From 38.01 to 99.00
b. Impact:
i. Very High: From 0 to 17.00
ii. High: From 17.01 to 27.00
iii. Moderate: From 27.01 to 38.00
iv. Low: From 38.01 to 99.00
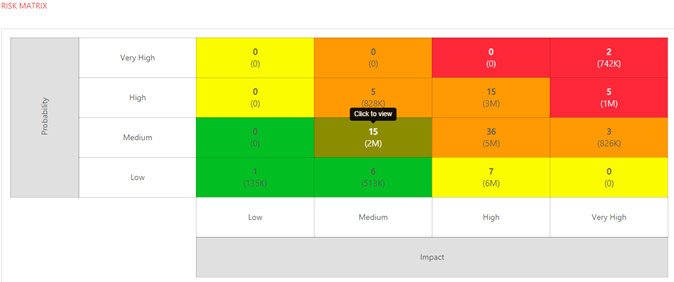
In each quadrant of the matrix, the system displays the number of proposals and the sum of the value of all of them. To view the list of proposals that make up the displayed information, simply click on the quadrant and a list will be displayed.
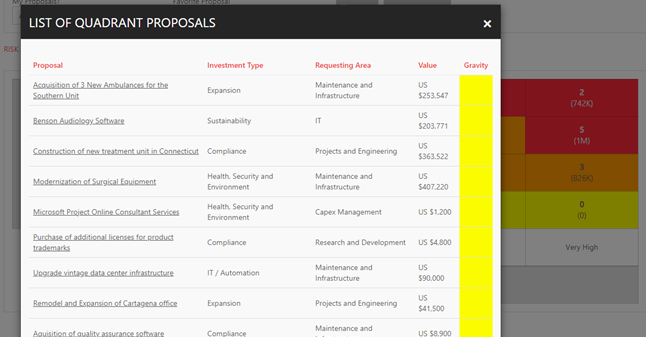
Below the matrix quadrant is a list of all the projects that make up the matrix, ordered from most risky to least risky. If the user wants to access any proposal, click on the ID.