The Realization Dashboard report displays various information regarding capex progress.
The report structure has the following composition:
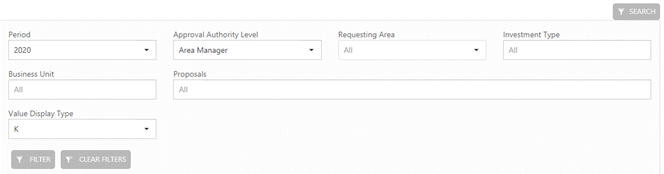
1) Search Filter: The report allows users to perform filters according to the fields below:
a. Period
b. Approval Authority Level
c. Requesting Area
d. Investment Type
e. Business Unit
f. Proposals
g. Value Display Type
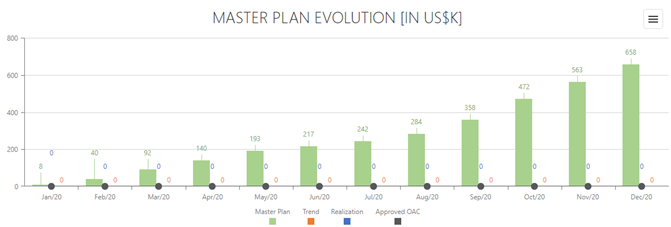
2) Master Plan Evolution: Displays information for monitoring the progress of CAPEX in the year, and the data presented as follows:
a. Master Plan: Value of proposals in the month prioritized by scenario
b. Trend: Sum of commitment and realized
c. Real: Value realized in the month
d. Approved BAC: Value of proposals in the month approved by committee
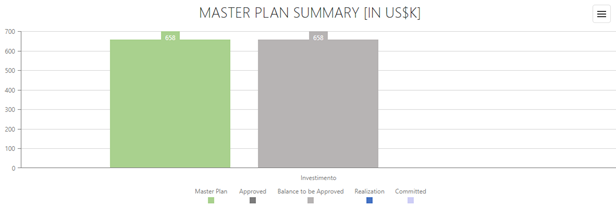
3) Master Plan Summary: Displays information for monitoring capex progress in the year, with the data presented as:
a. Master Plan: Value of proposals in the month prioritized in scenario
b. Approved: Value that has already been prioritized and has already been approved by the committee
c. Balance to Approve: Amount that has already been prioritized but has not been approved by the committee
d. Real: Value realized in the month
e. Committed: Committed value for the month
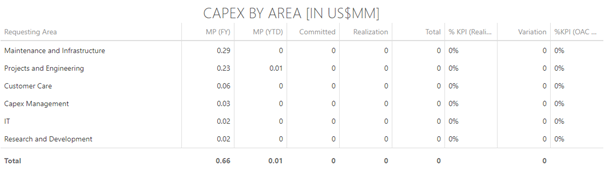
4) CAPEX by Area: Table with indicators of the Master Plan:
a. MP (FY): Value of the Master Plan of the fiscal year
b. MP (YTD): Value of the Master Plan until the current month
c. Committed: Value committed to the Investment Type
d. Realized: Realized value for the Investment Type
e. Total: Sum of the Values Committed and Realized
f. %KPI (MP Realization): Percentage of achievement in relation to the committed
g. BAC (YTD): Difference between predicted and realized
h. %KPI (BAC x Realization): Percentage of realized in relation to the value approved in committee
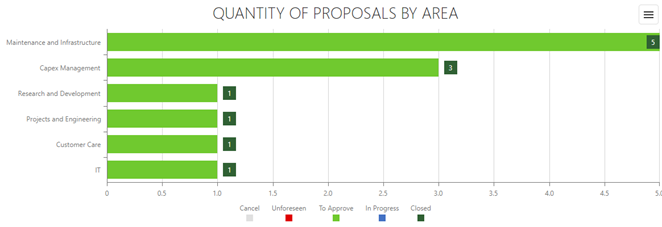
5) Quantity of Proposals by Area: Displays the number of projects by Investment Type, differentiated by status (Canceled, Unplanned, Approved, In progress, and Closed).
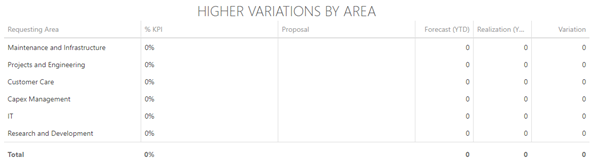
6) Higher Variations by Area: Table with indicators of the Master Plan (Budget of the year).
a. Requesting Area: Column with the requesting area
b. % KPI: Realized percentage of what was predicted
c. Proposal: Proposal with greater difference between commitment and realized
d. Forecast (YTD): Expected value until the current month
e. Realization (YTD): Value realized until the current month
f. Variation: Difference between Forecast (YTD) and Realization (YTD)
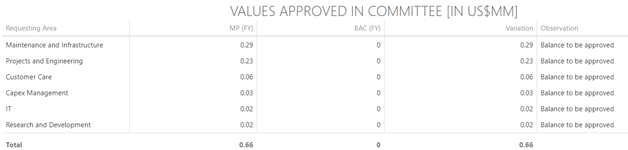
7) Values Approved in Committee:
a. Requesting Area: Column with the requesting area
b. MP (FY): Value of the Master Plan of the year
c. BAC (FY): Value approved in committee in the year
d. Variation: Difference between MP (FY) and BAC (FY)
e. Observation: If the variation is positive, the message will be "Balance to be approved". If negative, the value will be "Over budget"
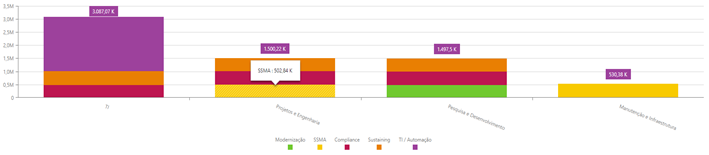
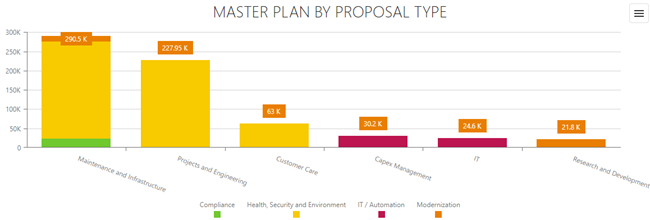
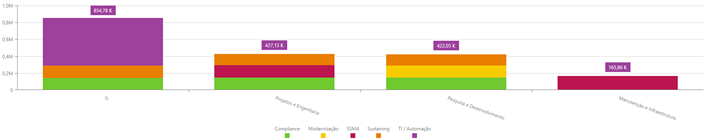
8) Master Plan by Proposal Type: Displays the Master Plan by Investment Type and Requesting Area
9) Realization by Proposal Type: Displays achievements by Investment Type
10) Trend by Proposal Type: Displays the Trend (Committed + Realized) by Investment Type